It doesn’t matter if a special education teacher has been around for 1 year, 5 years, or 15 years. The common complaint I have heard from all of my teachers is how are they supposed to keep track of all of the data that they need to collect on a daily basis! It’s enough to make a teacher’s head spin. With that in mind, I’m coming to you today to give you 4 easy tips on how to use data to inform and even improve your teaching.
1. Collect Data from a Variety of Sources
I love a good analogy but sometimes my analogies don’t always pan out like they should…so, stick with me here. Imagine you have to complete a dot to dot work sheet. The problem is that only numbers 1-25 are on the dot to dot. It’s supposed to go to the number 50. You connect the dots anyway. Dot to dot to dot. When you get to 25 you step back and look at your picture. Can you tell what it is? Not completely, but you may have a decent guess, but you may not.
In the same way that not having all those dots in your picture makes it harder for you to see and know the full picture- only collecting data in 1 way makes it harder for you to see the full picture of what your student’s abilities are.
Ultimately, when collecting IEP data you should always make sure you are collecting the data in the manner that the IEP dictates you should be collecting that data. For example, if a student has work samples as the method of collection for a benchmark, collect work samples. That doesn’t mean though that you HAVE to only
collect work samples. Could you complete some observations? Sure. Anecdotal records? Of, course! Portfolio? Maybe!
collect work samples. Could you complete some observations? Sure. Anecdotal records? Of, course! Portfolio? Maybe!
I’ll go a step further and give you an example. A student completes 10 math problems on addition with regrouping. If the teacher just looks at the problems when the student is done she can see that they are all wrong. The teacher can keep that as a work sample if that is all the IEP says she must record the progress by. On the other hand, if the teacher observed her and at minimum took anecdotal notes, she could see that the issue
wasn’t the actual borrowing, it may have been a certain number that was messing her up.
I’m a firm believer that good data collection can tell us a story. So, the more data points you have, the better and clearer your picture can be.
2. Point out the positives!
Seriously! In special ed, we tend to focus our efforts on the areas where our students need to improve. That’s our jobs. We look at gaps and work hard to help student’s close those gaps. The problem is with that way of thinking that we are never giving our students credit for the areas in which they excel. Point out their positives and also help their self-esteem in the process. It’s a win-win in my book.
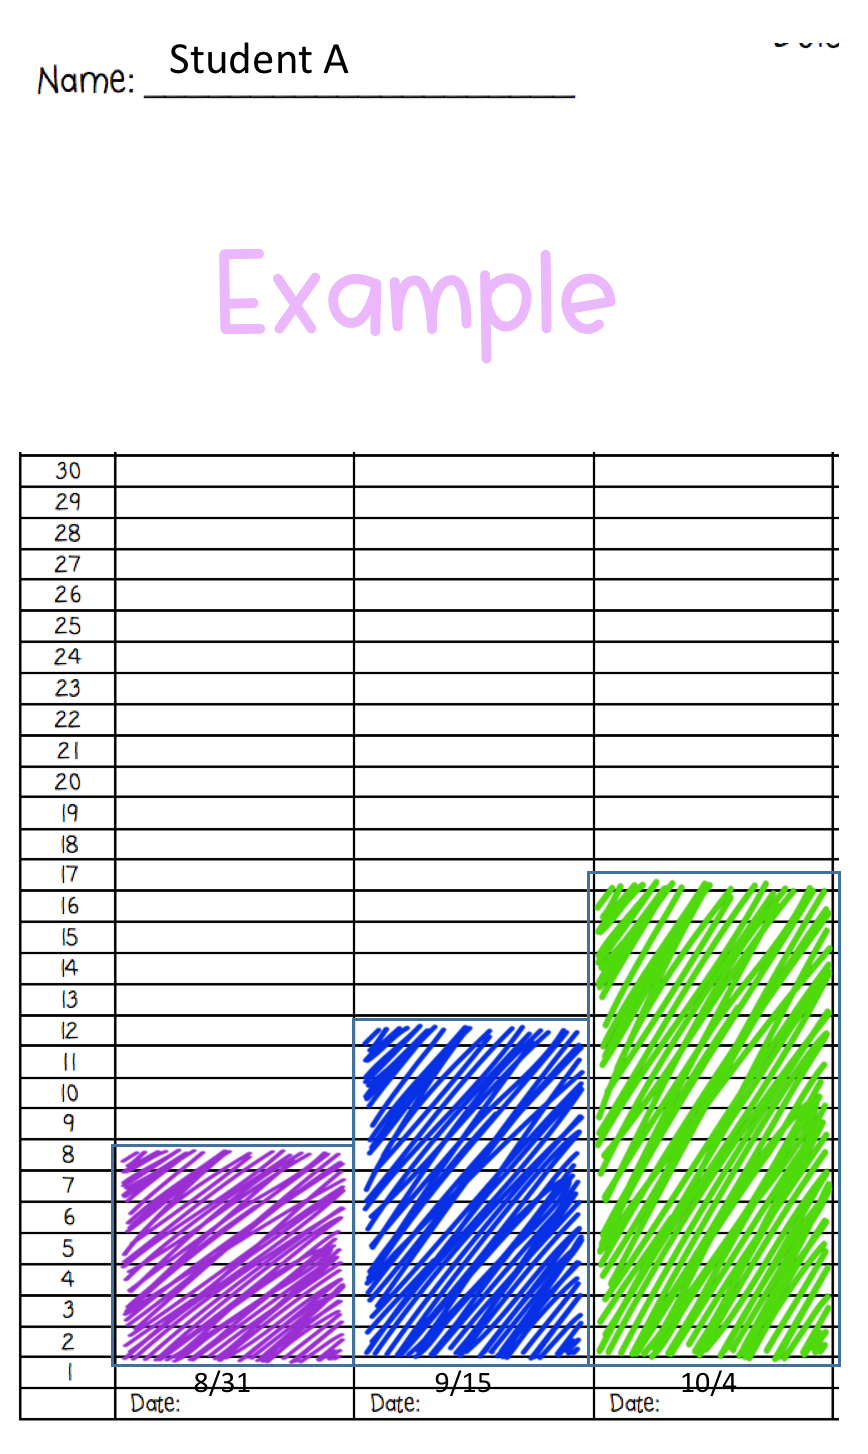
3. Empower your students to monitor their own data!
I LOVE accountability. I also love letting students see their own progress. Even still, I love when you can have their record their own data and it makes a graph like the one below. I had some students plot out their graph’s day by day, and by letting them fill in their own charts I saw their progress grow at a faster rate than a few other students who didn’t plot their own growth.
4. Use Evidence Based Practices
Not only are evidence based practices rooted in science and are strategies and methods that research tells us work, a lot of time data collection is built right in to them. Task analysis? Yep. Chaining? Yep. Meaningful Data collection and analysis is built into these core activities. Seriously. Become obsessed with EBP’s and use them daily.
These four things may seem small, but honestly, if implemented they can take your data game to a whole new level. Build a great big data picture then you can have Data that Don’t lie! 😉
In Laughter & Learning,


Leave a Reply